
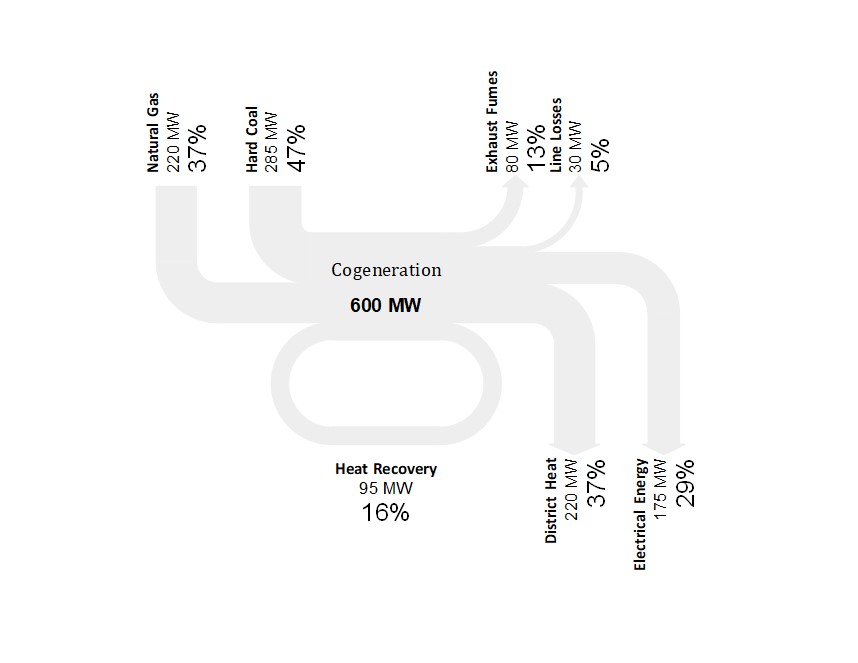
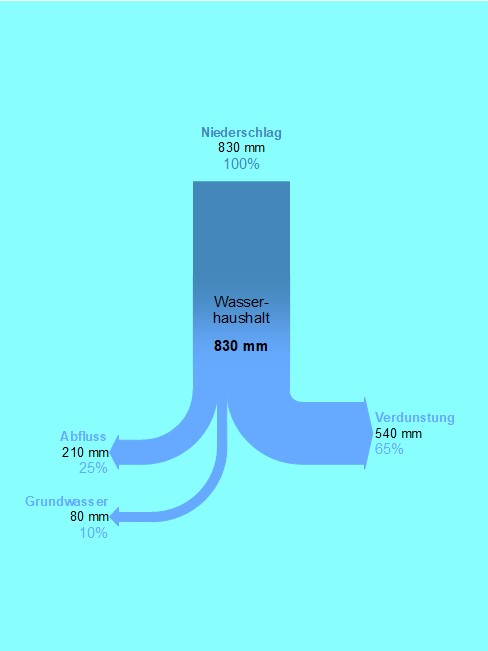
The Sankey diagram is a form of presentation of mass flows. It shows the proportions of the quantities by the thickness of the incoming and outgoing arrows. Sankey diagrams are well suited for the visualization of energy, material, or cash flows.
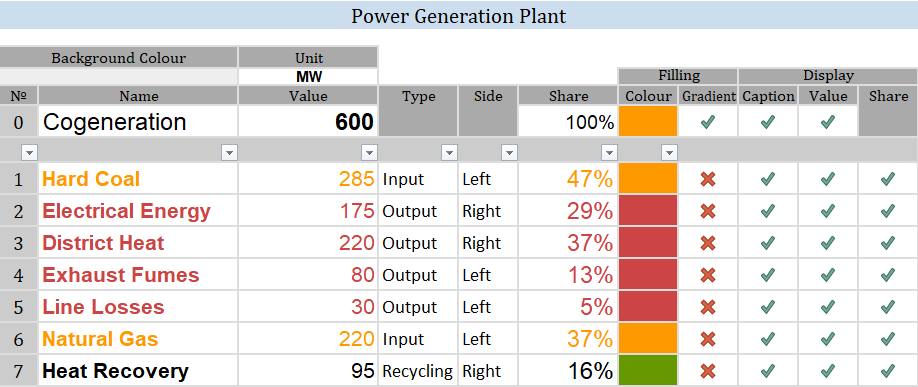
A Sankey diagram with a total of 25 incoming and outgoing branches can be generated with this tool. To do this, only the necessary data must be entered in a table. With some formatting, directly in the input table and a few mouse clicks in the configuration area, you can control the appearance of the chart. The following freedoms and restrictions apply to the chart:
The following formatting options are available:
Ten prepared design layouts are stored, which can be imported into the table and further configured if necessary.
This is not a sample solution or template in the strict sense. The graphs are not Excel charts, but a drawing that is made up of the available standard forms. This has the consequence that there are no possibilities of extension or adaptation of formula as in usual templates. On the other hand, the finished graphic is freely accessible and can be edited with the usual Excel Board means.
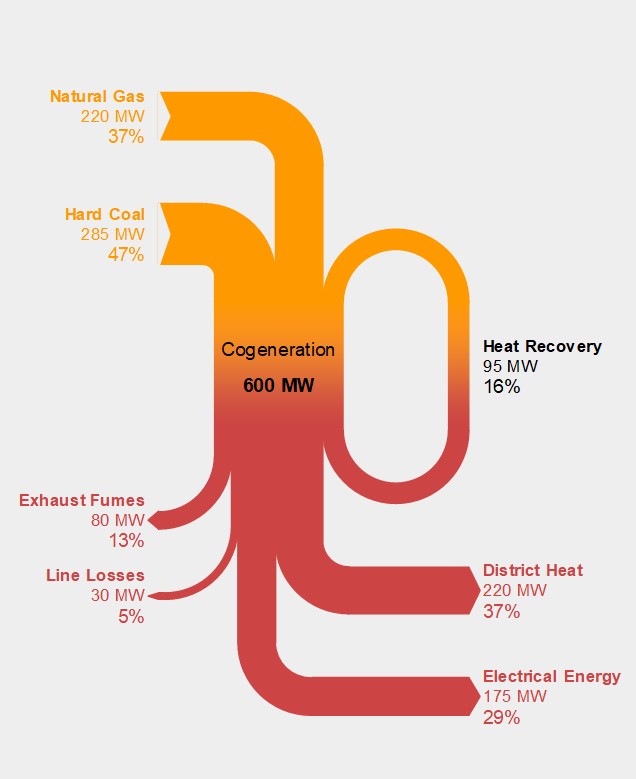
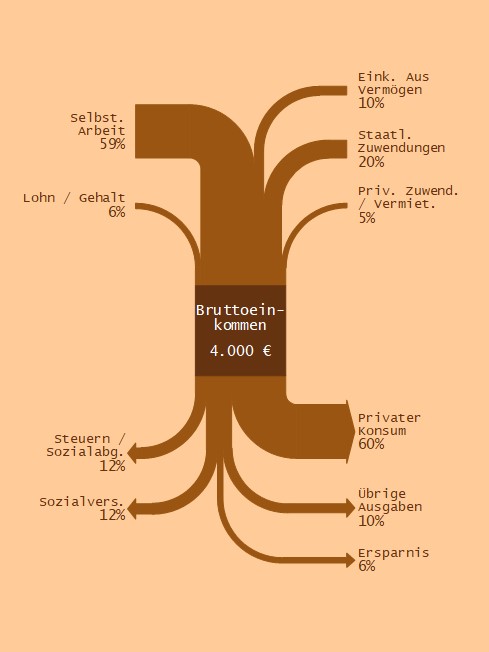
Each of the examples shown in the preview images created using this tool in less than ten minutes, without having done any post-editing of the image itself.
The tool can be handled intuitively. A detailed manual is included.
The tool is created for Microsoft Excel version 2010. Its possible that the template does not work under Macintosh. It contains protected program code (VBA).
A Sankey diagram with a total of 25 incoming and outgoing branches can be generated with this tool. To do this, only the necessary data must be entered in a table. With some formatting, directly in the input table and a few mouse clicks in the configuration area, you can control the appearance of the chart. The following freedoms and restrictions apply to the chart:
- Sankey diagram with one core (node)
- up to 25 incoming, outgoing, or returning branches
- at least one incoming branch
- at least one outgoing branch
- maximum one straight incoming branch
- maximum one straight outgoing branch
- maximum one recycling branch on each side
- no more nodes and branches possible
- optional caption of the branches with description, value, and percentage
The following formatting options are available:
- choice between portrait and landscape
- choice between two forms for the arrow ends
- setting the colour for each individual branch with or without gradient
- setting the background colour
- setting the font, font size, and font colour for each label
- controlling the display for every label, every value, and each percentage value
Ten prepared design layouts are stored, which can be imported into the table and further configured if necessary.
This is not a sample solution or template in the strict sense. The graphs are not Excel charts, but a drawing that is made up of the available standard forms. This has the consequence that there are no possibilities of extension or adaptation of formula as in usual templates. On the other hand, the finished graphic is freely accessible and can be edited with the usual Excel Board means.
Each of the examples shown in the preview images created using this tool in less than ten minutes, without having done any post-editing of the image itself.
The tool can be handled intuitively. A detailed manual is included.
The tool is created for Microsoft Excel version 2010. Its possible that the template does not work under Macintosh. It contains protected program code (VBA).