
This template is a tool for the implementation of the ABC analysis that handles processing and graphical presentation of the data, regardless of the specific cases of application (logistics, procurement, marketing, HR management, and others).
New: Strongly overworked version - now with 13 different graphic layouts for the presentation of the results, additional option of classification by absolute value, optional black and white or colour presentation and increased number of processible data sets.
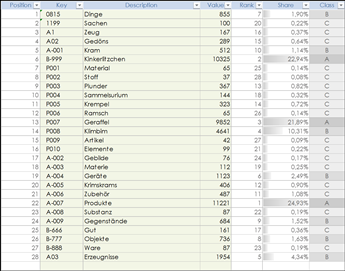
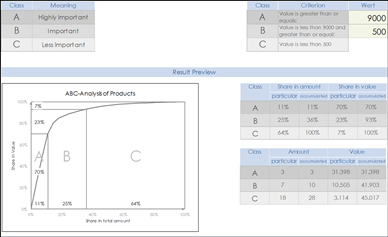
You enter only the single items with the values relevant to the classification. The tool takes over sorting, the calculation of the shares in value, the accumulation and the classification according to the criteria specified by you, as well as providing graphics for the presentation of the results.
Features:
The template is created for Excel 2010 and later. Its possible that the template does not work under Macintosh. VBA (macro code) is not included.
New: Strongly overworked version - now with 13 different graphic layouts for the presentation of the results, additional option of classification by absolute value, optional black and white or colour presentation and increased number of processible data sets.
You enter only the single items with the values relevant to the classification. The tool takes over sorting, the calculation of the shares in value, the accumulation and the classification according to the criteria specified by you, as well as providing graphics for the presentation of the results.
Features:
- Recording of up to 5,000 records
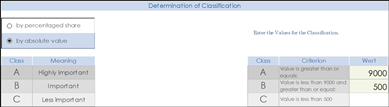
- freely selectable classification by value shares or absolute values
- preview image for displaying the effect of settings
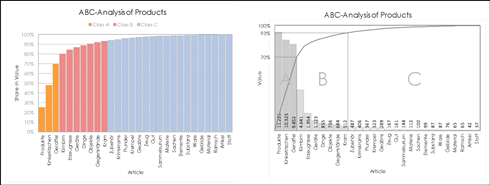
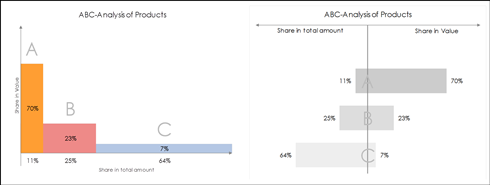
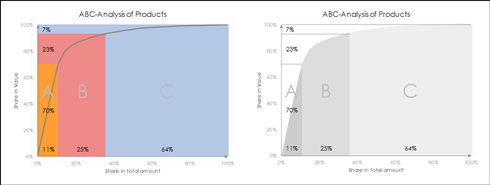
- providing a summary of the results in tabular and graphical form
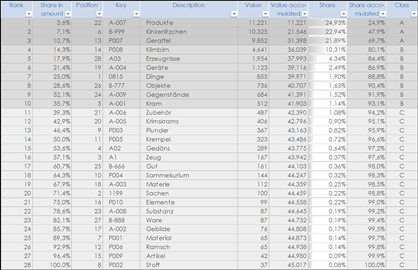
- automatically generating of a sorted list of the collected data
- choice of 13 different chart layouts (both in grayscale or colour version)
- intuitive, self-explanatory operation
- largely robust against mistakes (error messages and warnings)
The template is created for Excel 2010 and later. Its possible that the template does not work under Macintosh. VBA (macro code) is not included.